Financial Analytics Web Application
An interactive application for financial KPI exploration, scenario simulation and decision support.
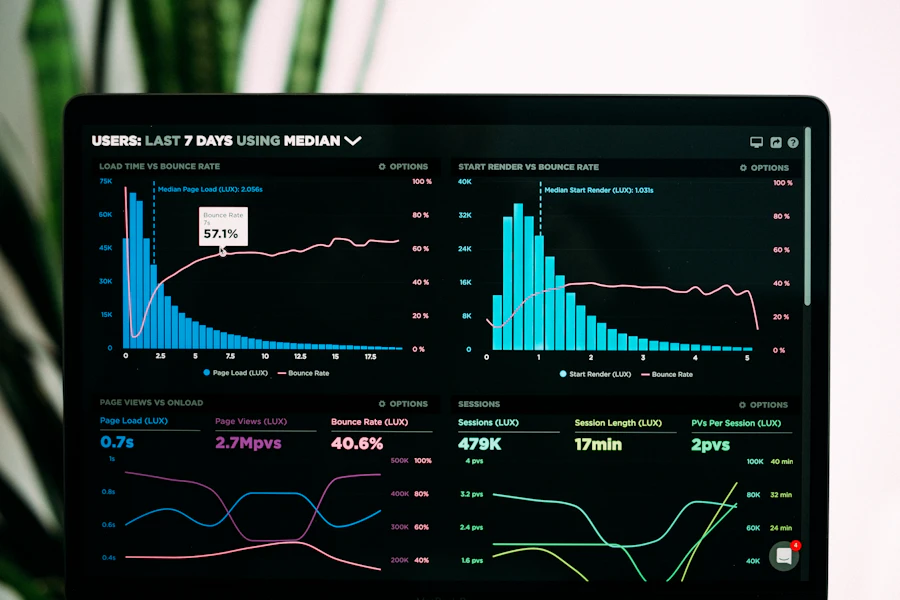
Business issue
Why I was brought into the project
A major French banking client needed a clearer way for business and functional teams to explore financial data, analyze KPIs and run scenario-based simulations.
Context
The environment around the project
A banking client needed a clearer way to explore financial indicators and test business scenarios.
Functional environment
The functional context focused on KPI exploration, financial scenario simulation and decision support for non-technical users.
Technical environment
The technical stack combined Vue.js, backend APIs, Dataiku datasets, automated validation workflows and dashboard-style interactions.
Challenges
The application had to combine financial logic, usability, validation workflows and Dataiku integration in a product that could support high-level decisions.
Solution
My contribution and its impact
My contribution to the project
I designed and developed a modern Vue.js frontend integrated with backend APIs, Dataiku datasets and automated validation workflows.
- Interactive financial analytics web application
- Scenario simulation interface
- API and Dataiku dataset integration
- Automated validation workflow integration
Impact
The application gave teams a more interactive way to understand financial indicators and test assumptions, helping them move from static reporting to actionable analysis.
- More accessible financial KPI exploration
- Faster scenario analysis for business teams
- Clearer support for high-level data-driven decisions
Impact metrics
Approach
How I structured the work
- Clarify the financial analysis workflows and the scenarios business users needed to run.
- Design Vue.js screens connected to APIs, Dataiku datasets and validation steps.
- Iterate on the interface so users could explore indicators and simulations with less friction.
Takeaways
What I learned from this project
- Financial applications need to make complex indicators readable without hiding the underlying logic.
- A strong data product is not only a dashboard: it needs workflows, validation and user-oriented interactions.
- Close alignment with functional users is critical when the product supports decision-making.